Travel analysis benefits from knowing not only where people move and what they are doing at the places they visit. Conventional travel surveys provide this information, but they are costly, infrequent and can under-represent activities such as leisure. Our research investigated whether digital traces from social media could provide a complementary source: first by developing methods to infer activities from users’ locations and posts, and later by testing how far the resulting mobility patterns could be transferred between different cities.
The challenge was to extract meaningful travel behaviour without treating every social-media post as an observation of a journey. People post selectively, different platforms reveal different information, and patterns of geotagging themselves vary between places and types of user. The research therefore moved from simply mapping posts towards a user-centred representation of recurring locations, activities and activity spaces.
Methods
Our earlier work combined geotagged Twitter records with place information from Foursquare. Density-based spatial clustering identified recurring locations, and text classifiers inferred the activities associated with posts. A subsequent study assembled geotagged tweets from ten European and US cities, separated likely residents from tourists and compared the spatial extent, recurring locations and temporal signatures of their activity. Applying the same workflow across cities provided a direct test of which patterns transferred and which depended on the local sample.
The first study developed an activity-inference framework using a large longitudinal Twitter dataset for Greater London. The initial database contained 482,883 users and more than 11 million tweets, including around 8.1 million geotagged tweets in Greater London. A subset of 50,344 relatively active users, representing more than five million geotagged observations, was then used for the detailed analysis. Links embedded in tweets were connected to Foursquare venue information, providing known examples of the types of places people were visiting. DBSCAN spatial clustering was then applied separately to each user’s history to distinguish recurring locations—places repeatedly visited for activities such as work or education—from isolated or occasional locations. Venue information from known Foursquare observations could consequently be propagated to other observations within the same recurring location. The venue information was grouped into 14 activity categories and combined with the text of tweets. Support Vector Machines, penalised Generalised Linear Models and Maximum Entropy classifiers were tested to infer activities from posts without explicit venue labels. This created a pipeline from a raw digital trace, through recurring-location detection and data enrichment, to an inferred representation of an individual’s activities and activity space.
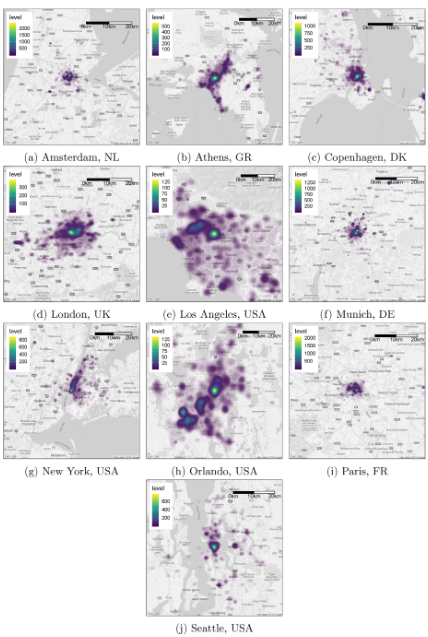
The subsequent research extended the question from activity inference within one city to transferability between cities. Geotagged Twitter histories were assembled for Amsterdam, Athens, Copenhagen, London, Munich, Paris, Los Angeles, New York, Orlando and Seattle. At least 1,000 users were sampled in each city and up to 600 historical tweets were collected per user. The analysis compared spatial coverage, temporal posting signatures and recurrent-location clusters, and separated likely residents from tourists so that fundamentally different mobility patterns were not combined.
Findings
The London study showed that social-media observations could be enriched substantially by exploiting the relationship between people, recurring places and text, rather than analysing posts in isolation. Starting from 65,806 tweets with known location characterisations, recurring-location matching expanded the set of observations associated with those locations to 172,675. The text-classification experiments also showed that activities could be inferred with useful accuracy: Maximum Entropy achieved an average F-score of approximately 0.79, while the penalised GLM achieved average precision of approximately 0.84.
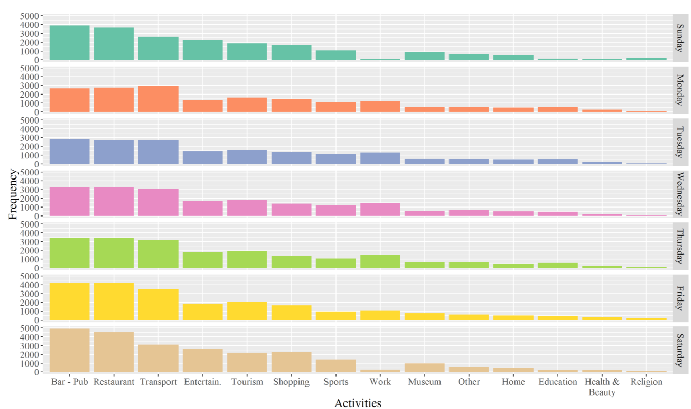
The activity labels also reproduced plausible temporal patterns. Work and education were more prominent on weekdays, while leisure-related activities occurred throughout the week; bars, pubs and restaurants were particularly visible in the social-media sample. These findings did not imply that Twitter represented the population as a whole, but demonstrated that seemingly unstructured digital traces could be transformed into structured evidence about activity patterns.
The later ten-city comparison showed why that qualification matters. Posting behaviour was not geographically uniform. The proportion of geotagged posts and the extent to which people posted from frequently visited locations differed substantially between European and US cities. Residents and tourists also produced markedly different activity spaces: tourists generally generated more recurrent-location clusters and wider activity spaces, making their separation important when interpreting city-level mobility.
Temporal patterns proved more regular than spatial ones, with recurring daily and weekly rhythms visible across cities, while spatial patterns reflected differences in urban form and social-media use. The cross-city analysis therefore moved the research beyond showing that social-media data can reveal mobility patterns. It demonstrated that the sampling process itself is part of the transport evidence: methods developed in one city cannot simply be applied elsewhere without examining who is represented, how people use the platform and whether residents and visitors are being mixed.